Monday, June 30, 2008

Omniture Test & Target: an alternative to costly site redesign

Over a month ago Omniture announced a new release of Test & Target and I finally had time to look at it. With the recent release of Omniture Survey, combined with Site Search and Publish, the suite looks like a viable and strong alternative to costly site redesign. In fact, as an ebusiness strategist and web analytics consultant, I often run into scenarios where traditional approach to web development could be greatly enhanced by taking a radically different approach.

Low pain, fast results, continuous improvement

By combining multivariate testing and behavioral targeting, Omniture not only makes it very easy to start testing, but can even use the results to automatically influence subsequent behavioral targeting. In my consulting I try to use the SixSigma DMAIC (Define, Measure, Analyze, Improve, Control) approach, or as Omniture put's it "Change, Track, Target". The process gets significantly accelerated:
  • Introduce home page personalization based on powerful segmentation (ex. keyword search, geography, visit frequency, ad shown, etc.)
  • Optimize on/off site ads and campaigns
  • For ecommerce, automatically build a top sellers list or even a recommendation engine
  • For media sites, update top stories based on behavioral data
  • Use the platform as a mean to manage content, promotions and offers over time
  • etc.

Control delegation

We all heard horror stories about marketing wanting to do something but being "stuck" by IT's abilities (or lack thereof) to deliver. Not prioritized or too many priorities, no budget, no time, no ressources or in even worse, crass political interests are only some of the reasons for the tension that often exists between marketing and IT. I've been on the IT side for most of my career... I know the story. Let's face it, for most organizations, "developing a web site" is far from their core competencies and so many aspects of websites have become "commoditized" that it simply doesn't make sense to develop thousands of lines of code to do an online catalog and checkout.

These days, most sites are built off templates (be it CMS or catalog driven) and a home page layout usually doesn't radically change every week... Try asking IT to build multiple versions of your home page and "render" control to marketing... good luck. Ask IT to change the home page template to include what are called "mbox" once (snippets of JavaScript code delimiting an area controlled by Test & Target): a lot easier. Agreeing on "who owns what" usually involves some political discussions, but once set, you are in full control of those content areas.Content can even be served off the Omniture infrastructure. IT can focus on optimizing core business processes and marketing can focus on the message and the online user experience.

A scenario

For some of my ecommerce clients who happen to be using Omniture HBX and who's ecommerce technological platform have reached its end of life, the current plans are to do a complete site overhaul: new technology, new design, greater marketing possibilities and of course, migrate to Omniture SiteCatalyst. Given the current state of the economy, the size and scope and cost of those projects, the difficulties to find good resources and the risks they imply, I would offer a radically different approach. Interestingly, despite being in two very different verticals, they share very common challenges:
  • Missed sells opportunities, low fidelity: new customers are not easily exposed to the full/better offerings and the low fidelity of existing customers require a constant focus on customer acquisition
  • Inability to do behavioral targeting: all customers are treated the same
  • Weak internal search results: no results, wrong results, too many results...
  • Manual cross-sells and top-sellers updates
  • Strong reliance on IT for any changes, never resolved and growing list of bugs and complaints, performance and stability issues, etc.
  • Expensive maintenance and development due to a technological platform that works at a low level (more of an SDK than a platform)
  • No Voice Of Customer at all

My take

As an alternative to the above scenario, consider this:
  • Migrate immediately to SiteCatalyst to strenghten the "fact based decision" approach
  • Modify the home page template, make extensive use of Test & Target to tailor the user experience according to each campaign, keyword or location
  • Modify content categories pages to automate recommendations and best sellers
  • Integrate Omniture Survey as a mechanism for content/product rating
  • Use Survey to listen to the voice of customer
  • Use Site Search as a search/recommendation engine
  • Maybe even consider Publish as a viable CMS/catalogue engine alternative
If you are already using SiteCatalyst, there are huge opportunities in integrating Test & Target (and Survey). The pricing structure, which is similar to the SiteCatalyst model, will allow you to start doing experimentation & targeting gradually without commiting to a huge investment. When conducted appropriately (I'm thinking "resources" and "process" here), the tool ROI will become positive very fast.

Speculations

In a previous post, I speculated the next Omniture acquisiton might be in the mobile or performance analytics. Based on the scenario above, it seems the missing piece might be more in the profile management and process engine (checkouts and such). Think of something like Coghead, Zoho Creator or Caspio.

Sunday, June 29, 2008

Web Analytics like lettuce & spinach

A while back, someone inquired about the proper balance between web analysts tasks, a topic I also covered a while back. I initially replied to the Yahoo! Web Analytics Forum but wanted to repost here:
How do you strike a balance between information-gathering/data-analysis and report-creating/insight-sharing at your job?

In other words, we as Web Analysts are paid to PRODUCE, am I right?

What percentage of what you do would you say is thinking and education, and what percentage is making something tangible?

I'm curious; what do you think is the "Proper" balance?
I would argue that we're not paid to "produce", we're paid to bring insight. A farmer produce lettuce and carrots for someone else to transform into salad... a web analyst should provide insight that can influence business decisions and lead to specific actions. To stay in the same analogy, our role is to advise the farmer to produce spinach because demand is growing and would be more profitable than lettuce.

Reports are tools; a mean of communication that supports our advices and makes it easier to "pass along to others". Most managers loves reports because they are tangible, they can show it off and pass it along to their colleagues. But the real value hidden in the report are not the charts and tables, it's the story they tell.

I'm also a freelance, so maybe it's not a good reference. But I spend as much as 30% learning, educating myself and staying tuned to the business. In my case, "the business" is the web analytics field in general, but also the specific vertical industries of my clients. Then I spend another 40% doing analysis and finding ways to communicate info more effectively (see my post about Web Analytics Dashboards: fun with Excel 2007). Another 20% actually communicating the results, coaching and increasing my clients web analytics maturity. The remaining 10% is mostly admin time.

Monday, June 23, 2008

Omniture Survey: it was just a matter of time

Fresh from my inbox: the newborn from Omniture: Surveys!

Omniture is widening its offering with this addition. Surveys are much more than polls, they offer various question types and usually offer advanced branching rules. From the product overview, it appears surveys can also be scheduled, use samples, be used for product reviews and rating, abandonment and such. Combining the various products from the Omniture family makes it an amazingly powerful suite: SiteCatalyst & Discover, SearchCenter, Test & Target, and now Surveys and of course, Genesis and API... competition is starting to look pale in comparison.

Next on the list? Performance analytics? Serious mobile analytics?

Web Analytics Dashboards: fun with Excel 2007

Update 2008-08-11: Read "Even more Web Analytics Dashboards Fun in Excel 2007!" and get an enhanced version of this spreadsheet!
Defining KPIs and designing dashboards is challenging for most web analysts. Even if you are lucky enough to use such tools as Tableau or Crystal Xcelsius, you can still go a long way just with Excel 2007. Read on for some tips I've come up while creating dashboards for my clients.


A word on KPIs

I think it's fine to show base metrics on a dashboard, such as Visits and Visitors, Orders and Revenues, etc. People can easily understand what they are and those represent the lingua franca of web analytics. But I also want to show "composite" metrics such as:

  • Conversion rates and ecommerce: customers/visitors, orders/visits, items/orders, average order size, etc.

  • Success rate: ratio of any success events by visits, such as orders, of course, but also subscribing to the newsletter, participating in a contest, etc.

  • Engagement: I leave it to you to find your own formula, but thinking in terms of "persuasion architecture" we can identify waypoints, points of resolution and conversion events that are significant, assign weighting and values to those events and create a good indicator.


Current vs previous periods

A raw number without context is useless. Just saying "we had 150,000 unique visitors this month" doesn't provide enough context. If I add "... vs. 120,000 last month" it's already better. I'm always reporting the current month vs the last, and the current month vs the same month of last year. If you look only at the peaks and lows over months, you won't see the annual cycle that is characteristic of most sites.

% Change & indicators

The next thing to add to our dashboard is an indication of the magnitude of change. Did we significantly increase visitors or it's just a small tip? Then we want to add an indicator, such as an up or down arrow which will make it easier to spot metrics that might be correlated.

  • Formula: % Change = (this period metric/previous period metric)-1

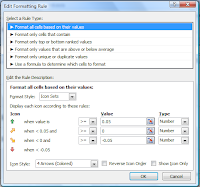
  • Format: from Conditional Formatting, choose Icon Sets, 4 Arrows (Colored).

  • Rules: over 5% improvement is green, below 5% degradation is red, etc.Using an indicator along with the color will help those who are colorblind (1% of the population).


Sparklines

There are many ways to create "sparklines" and even some Excel addons like Bissantz SparkMaker or BonaVistaSystems MicroCharts. I think Excel 2007 does a pretty good job "out of the box":

  1. Create a line graph that includes 13 months of data (remember we want to see "this month" vs "same month of last year")

  2. Clean up everything (title, axis, legend, lines, etc.)

  3. Put this new chart in a slightly enlarged cell and voilĂ ! You have a spark line


Ok, now we have a nice little graph... pretty cool! But we lost the scale and it's often hard to see the real significance of this little graph. So let's add some control limits:

  1. Click on the line

  2. From the Chart Tools, Layout menu, click on Error Bars and Error Bars with Standard Deviation

  3. Some cleanup again; right-click on the error bars area and do Format Error Bars

  4. Direction: Both, End Style: No Cap, Standard Deviation: 1.0

  5. Line Color: 80% transparency and Line Style just wide enough to overlap each other by one pixel (bug: Excel won't keep those changes if you change the main graph)

In the example above, notice the trend over a 13 months period and two areas where the line goes outside the limits. If you look carefully, you will also notice small lines which are the months ends.

Control limits and significance

I already talked about box plots, significance and outliers. How do you know if your current metric is way out of bound? This is called an "outlier": the strict definition is "an observation that is numerically distant from the rest of the data". Since our data is usually pretty much a normal distribution, using the mean and standard deviation is ok:

  • Upper Control Limit = Previous 12 months Mean + Standard Deviation

  • Lower Control Limit = Previous 12 months Mean - Standard Deviation

With some layout, we can show the Upper Control Limit, the Mean and the Lower Control Limit. Combined with the above sparkline, we end up with something pretty cool!


Dashboard sections

Each client is different, but I usually create a couple of sections grouping related metrics, such as "General Statistics", "eCommerce" and "Conversions". One section that I particularly like for ecommerce or content sites is "Movers & Shakers", which goes beyond the "top 10s" and show those items that changed the most over the previous month.


When printed, each section of the dashboard must fit on a single page with enough room to take hand written notes.

Analysis

As an analyst, you should always add a couple of lines verbally explaining your analysis. You never know where the dashboard, either printed or electronically, will end up. Unless one metric is really significant, I prefer to put my comments at the bottom of a group of metrics and "make up a good story" about what happened. And please, don't just say "This months visitors are up"... this should already be obvious enough! "The increased traffic is representative of our annual sales cycle and confirm the significant (33%) improvement we've been seeing over last year."

Segmentation, automation & customization

I include a "control center" at the top of the Excel dashboard where you can pick the month and any other appropriate segmentation. This way, from a click of a button, you can easily switch back & forth between months or segments. All the data in the dashboard gets automatically updated.


Of course you don't want to spend days and weeks updating your dashboard. The data is fetched from other tabs and whenever possible the raw numbers are imported (for example, if you are using Google Analytics) or better still, hooked up through an API (for example, through Omniture SiteCatalyst Excel client). Some fairly sophisticated Excel formulas (not even macros) are used to automatically update everything.


From this master template, I can create dashboards much more easily and with a few quick changes, I can remove or add new metrics and KPIs.

Your take?

If you want to go further, I recommend the book "Information Dashboard Design: The Effective Visual Communication of Data" by Stephen Few and the Dashboard Spy blog is a pretty good source too.


Do you have any dashboard tricks to share? Any sugestions on how to improve my dashboard? I would love to hear your feedback!

Wednesday, June 18, 2008

KB 261186: Computer randomly plays classical music

Want to see an intriguing Knowledge Base article from Microsoft? Read on!

A while back I posted about the evolution of the infamous Microsoft "blue screen" error. I managed to get a Vista Blue Screen!

But today, a friend sent me a link to a real knowledge base article. A real gem! It states:
During normal operation or in Safe mode, your computer may play "Fur Elise" or "It's a Small, Small World" seemingly at random. This is an indication sent to the PC speaker from the computer's BIOS that the CPU fan is failing or has failed, or that the power supply voltages have drifted out of tolerance.
...
Although these symptoms may appear to be virus-like, they are the result of an electronic hardware monitoring component of the motherboard and BIOS.
How clever of them! I wonder if Microsoft did some A/B test to find out if it was better to play classical music instead of heavy metal...

Firefox 3 is out, get it now!

You should have heard by now that Firefox 3 is officially out. I've been using the beta & pre-prelease versions for a while to test WASP and I found the v3 to be radically faster.
Firefox 3
Of course, WASP is compatible with this new version.
Add WASP to Firefox

Friday, June 13, 2008

Neuralitic: mobile analytics the ultimate way

Disclaimer: I'm on the product advisory comity of Neuralitic.
My increased role as web analytics industry specialist put me in contact with lots of companies involved in all kinds of analytics, far and abroad. Two weeks ago I talked about Coradiant's focus on performance analytics, earlier this week I presented Percute Technologies and now I would like to introduce Neuralitic, a Montreal startup doing really serious stuff with mobile analytics.

A gold mine of data

In Web Analytics, cookies are our friends. In mobile analytics, cookies pale in comparison to what is possible. Cell phone carriers knows a heck of a lot about you: phone number is pretty much unique to you, triangulation can pinpoint where you are, they know about your cell phone plan and your credit score, they know all about your demographics, and exactly when/who you called and which applications you used.

Mobile analytics for web analytics

Most existing solutions such as Mobilytics focus on identifying mobile users when they interact with your website. For the large part, they will simply identify those visitors coming from carrier X with cell phone Y and a couple of other informations. Then you're left in the dark: in most cases, cell phones don't have cookies, they don't run JavaScript, and they don't run Flash.

However, the technology is evolving fast toward G3, especially with the hype around the widespread availability of advanced cell phones such as the Black Berry and the Apple iPhone (coming to Canada on July 11th!). The actual constraints of speed and technology are fading away. But is that all there is? Why would we limit our analytics only to cell phones accessing our web sites? What about mobile ads, gaming, videos and applications running on mobiles?

Neuralitic: taping on the wireless backbone

Neuralitic is a probe that listen to the traffic between your cell phone and the provider. As such, it is not targeted directly at website owners, but at carriers and content providers that have a close partnership with the carriers. Basically, Neuralitic can provide information about any wireless IP-based trafic: weather/traffic/mapping services, games, SMS, email, browsing, etc... It can gather up to two 2 years worth of data that can be merged with other sources of data owned by the carrier.

Of course, this is highly valuable data for carriers themselves, allowing them to narrow-customize their offering. Carriers are not making much money on voice anymore. The future is the data, not the voice; good mobile analytics becomes even more critical. Carriers could also elect to offer the data as an added service to their business clients: providing demographics, advertising profiles and much more.

My take

I'm no mobile expert. But I remember last year's Web Analytics 2.0 definition from Avinash Kaushik and the "multiplicity" concept. I also remember the resulting race for the next buzzword: Web Analytics 3.0 from  Peterson and his focus on mobile analytics. I also commented on my own: do we really care if it's 2.0 or 3.0?

From a "business analytics" perspective, mobile analytics and the new data it offers, as amazing as it can be, is just another source of information to take better business decisions. Easier said than done, I agree, since most companies are already struggling with web analytics. But what Neuralitic is doing, and the way they are doing it, is simply amazing and will not only make it a lot easier, I think it has the potential of significantly changing the online marketing landscape.

Thursday, June 12, 2008

Montreal-based Emovendo named Google Website Optimizer Technology Partner

Google announced today the Google Website Optimizer Technology Partner Program and Montreal based Emovendo is among the first six companies to be part of that new program.

The key element is to "make it easier by offering specific documentation and technical support. They can also automate the process of adding Website Optimizer tags, so you can launch experiments faster than ever, with fewer dependencies on your IT team."

Emovendo's PageVester is a very intuitive landing page generator that integrates with SalesForce. Create an efficiently designed landing page, publish and manage your campaign, then collect the results directly into SalesForce as new leads. I know this will please a lot of marketers: create profesionally designed landing pages without any IT intervention.

As a Website Optimizer partner, PageVester's point and click interface alreadt allows easy integration of Google Analytics, AdWords campaign management and now makes it very easy to apply multivariate testing to those landing pages.

Tuesday, June 10, 2008

Percute: personalized & extensible web analytics for agencies

As a web analytics solution provider, how can you compete against the triad of free tools from Google, Microsoft and Yahoo! if you are a web analytics startup? You don't.

But Quebec-city based web analytics player Percute Technologies is doing well with a personalized, extensible offering for web agencies.

The usual stuff and beyond

Percute offers the usual round of page views, visits, visitors, referrers, path analysis and such in an intuitive and nice interface (you don't reinvent what works well). It even offers good segmentation capabilities, video-tracking, Flash, real time view of site sessions and step by step analysis.

But where Percute really distinguish itself is in its ability and ease of adding custom metrics and reports. They basically offer a custom tailored solution.

Being local, being personal

Since they are in the same city I am, and they also are entrepreneurs, I met with the Percute team several times. Stéphane Guérin and Philip Boumansour are very active serial entrepreneurs behind local successes such as:
Their philosophy is simple: you can offer tailored and highly valuable services that are distinctly different from the traditional north-american behemoth. A while back I discussed about cultural differences; the goal of staying local and personalized is counter culture to most American entrepreneurs objective of becoming the next Google (that might be just a perception non-american people have about the US...).

For agencies

After touting the direct sales model, they reoriented toward agencies: allowing marketing and web agencies to resale branded and customized versions of Percute to their own clients. To my knowledge, this is pretty much unique in the web analytics market.

My take

I initially met Stéphane in one of my MBA class and we had good discussions about Percute's business model. I think they have found a niche that suit them well and serves a real business need, especially in a local, French-based context. The challenge is always to explain the benefits of Percute vis-à-vis Google Analytics and getting a few local big names on board. Once they break this barrier I'm sure things will get rolling.

Wednesday, June 4, 2008

Celebrating immeria.net and life in general

Today, June 4th, 2008

I've been working for 21 years, actively involved in the Internet and Web development for 15 years. Been blogging for over 5 years and posted over 300 messages.

I found this morning that I now have over 500 subscribers to this blog, plus close to a hundred to the web analytics conversations. Although my roots in analytics might date back to the days when I was an Oracle database administrator, or when I was looking at CERN HTTP logs, the graph below clearly show when I started to blog more seriously about web analytics.

Retrospective

  • December 2007: Officially became web analytics freelance and entrepreneur while pursuing an eBusiness MBA. Of course there are some constraints, some hard work and some stress, but I've been enjoying the past 6 months like a child in a toy store.
  • October 2002: First blog post, in French, where I welcome hypothetical readers and explain what is a "blog".
  • October 1994: After explaining why it was so important to have a web presence and literally building the first site over nights and week ends, Softimage, then a subsidiary of Microsoft, launched a first website (this version comes from a snapshot in 1997, when I was part of a team dedicated to the web).
  • August 1994: First proof of a website I built for an R&D project at Hydro-Quebec
  • June 1993: My first archeological presence on the net (a bit scary to still find it!). A message about system administration on SunOS machines.
See my full profile on LinkedIn.