Friday, April 27, 2007

Study: first results are in!

The sample size for my study on the Attention Map of Web Analysts is not large enough (yet), but I wanted to share a first snapshot of the results as a tease for others to take the 10 minutes survey!

I leave it up to you to find out which task is the most captive and front of mind, and which one is the most voluntary (hey! I can't spoil my results just yet!).

If you are a practitioner, a consultant or working for a web analytics firm and your job includes some web reporting and analysis, please fill out the survey.

If you are blogging about web analytics, I would be grateful if you could spread the word about this research and help me get more survey results.

Thursday, April 26, 2007

Study: Mapping Attention of Web Analysts

Those of you who have been following my recent posts knows about the "attention economy" and that I want to apply those concepts in web analytics. What better way to show how valuable it is than a real world demonstration!

Take the 10 minutes web analyst survey!

Primary objective

Quantify how web analysts spend their time on various tasks, and more importantly, what type of cognitive process they engage in while doing those activities.

Secondary objectives

  • Demonstrate time ≠ attention
  • Help web analysts understand their own job characteristics and explain it to their managers and fellow workers
  • Demonstrate the potential application of "attention" metrics as a qualitative element of a user experience on the Web (in a future study)

Methodology

  • Typical web analyst tasks, as defined by Avinash Kaushik in "How Should Web Analysts Spend Their Day?", are used as a basis, assuming those tasks are representative:
    • Reporting
    • Analyze acquisition strategies
    • Understanding on-site user experience
    • Stay plugged into the context
    • Explore new strategic options
    • Other activities

  • The AttentionMap questionnaire and methodology from The Attention Company is used to quantify the various types of attention being given to each task:
    • Overall amount of attention and how it is divided between different areas
    • Aversive or attractive
    • Front of mind or back of mind
    • Captive or voluntary task

  • A Zoomerang survey is used to collect responses from participants.
  • The target audience for the survey is initially the The Web Analytics Forum on Yahoo! Group and might be re-linked from other blogs.
  • Survey sample: the exact population size is unknown, but this study aims to collect at least 278 responses before June 1st. This would represent a confidence level of 95% with an error margin of 5% for a population size of 1,000.
  • Anonymously collected survey data will be analyzed and filled in the AttentionMap.

Results availability

AttentionMap results will be published on this blog, along with a detailed analysis. Collected survey data will be available upon request.

Disclaimer

I have no financial interests in this study. I am not professionally affiliated with any of the afore mentioned companies or individuals.

Monday, April 23, 2007

Local company profile: NVI

Guillaume Bouchard, CEO of NVI Solutions is looking for a web analytics expert.

The company is a fairly new Web 2.0/Internet Marketing agency in Montreal who currently employs 20 people and can't stop from growing. They have a dedicated team for web development and design, and another doing SEO/SEM/SMO/Internet marketing. If you are crazy about data & metrics and have a great sense of entrepreneurship, it might be a good opportunity!

The team from NVI also blogs about Web 2.0, search, marketing and SEO on an interesting site called Go-Referencement.org (French).

Friday, April 20, 2007

Page view is dead, long live "time". Not!

I just read trough the very insightful article "Defining Attention on Websites & Blogs" from Joseph Carrabis on iMedia Connection. We both share the same skepticisms about using "time" as the sole metric in the evaluation of "attention". Don't take me wrong, I'm not saying time isn't a useful element in the evaluation of attention, I'm raising a flag to the fact that both Compete.com, and now NetRatings are releasing reports where "time" seems to be the new golden metric, replacing the "page view". When we read "time spent is probably the best single indicator of user engagement" in the NetRatings report, I can't help but wonder what was their mindset when they wrote that.

When we look at the "time per visitor" results of NetRatings, most of the top sites share one characteristic: they facilitate the state of "flow". Flow was described by psychologist Csikszentmihalyi as being "the mental state of operation in which the person is fully immersed in what he or she is doing, characterized by a feeling of energized focus, full involvement, and success in the process of the activity"... and a distorted sense of time...

In the end, it will be up to web analysts and experts to educate their audience about the real value or misleading conclusions that can come out of the "time" metric. And the answer, as usual, is "it depends". But I still strongly feel than any analyst using only a "time" report to explain "attention" or "engagement" should be turned back to their desk and dig for a better story.

Thursday, April 19, 2007

Cookies will get you fat

The recent press release from ComScore about cookie deletion rates fired up very good discussions on the web analytics forum. Here's my 2 cents about it.

Nutrition facts

  • Cookie deletion rates appear to be very similar for 1st and 3rd party cookies
  • Cookie deletion might inflate unique user stats by 2.5 to 12.5 times
  • About 30% of the people surveyed delete their cookies at least once a month
  • The previous study, from JupiterResearch, reported a rate of 39% of people deleting their cookies (2005)
  • The study was conducted for a month, using 400,000 home PC's.

Health analysis

  • When users delete their cookies, they don't discriminate if they are 1st or 3rd party cookies... they delete all of them. The slight difference between the two would be the impact of using privacy tools that automate the blocking/deletion of 3rd party cookies (between 1% and 3% more deletion for 3rd party than 1% party - not really significant)
  • The margin of error when reporting on "unique users" becomes larger as you increase the time span. Looking for unique users within a week is more accurate then looking at them within a month (or worse - a year).
  • The study from ComScore doesn't cover the fact that more and more users are using multiple devices (home & company computer, PDA and other devices) and even multiple browsers (sometimes switching between Firefox and MSIE, both installed on the same computer). So the notion of "unique user" should be retitled to "unique device + browser"
  • The inflation of the numbers doesn't change the trend, it only changes the scale.

Recommendation

  • Avoid providing hard numbers; trends and context are essential.
  • Use the "visit" as the metric of choice, think in term of "opportunity".
  • The only instance where you should report on "unique users" is when you can use a real unique identifier such as a login.

Salted cookie

  • ComScore business model relies on panel users, it's hard to imagine another conclusion than something implying panels are more accurate than other methods.
  • ComScore filled a 85$M IPO on April 3rd, the timing of this report is certainly not a coincidence.
  • ComScore have not published the details about the methodology. What could be the implication of rewarding panel users for their participation? Exactly how/if anything that could influence user behavior was was communicated to the panel users.

Wednesday, April 18, 2007

Quebec's analytics community is heating up!

Lot's of activities coming up!
  • If you are from the province of Quebec and planning on attending eMetrics in San-Francisco (May 6-9), please let me know. And if ever that can help you convince your boss, I could probably split the room cost at the fabulous Palace Hotel!
  • On May 15th, my friend Jacques Warren will do a full day class on Webtrends in Quebec city. The training is non-technical and will address the use of Webtrends for web managers.
  • Then, on May 16th, join me and other Omniture users at the first ever Omniture Café in Montréal.
If you have other events you would like to communicate, please let me know!

Occasionally, I'm being contacted by companies looking for talent, or people looking for a new challenge. Feel free to contact me by email and I will share the appropriate information with discretion.

In case my boss reads this: don't worry, I'm not looking for a job, I'm very happy where I am :)

Omniture Café - Montréal, May 16th

Normally, the Web Analytics Wednesday would have been on May 9th, but I will be at eMetrics in San-Francisco to present the course "Web analytics for site optimization". So as a bonus, I'm really excited to announce we will have a very different activity on May 16th!

Omniture Café

The Omniture Café has been traveling around North America with overwhelming success and our next stop is Montreal!


Here is your chance to join your innovative group of Omniture professionals and enthusiasts. Omniture Café’s are a great way for you to network, share ideas and experiences to get the most out of your Omniture investment.

When: May 16, 2007
Time: 5:30pm – 8:30pm
Where: Hyatt Regency Montréal
1255 Jeanne-Mance
Montréal, Québec, Canada

Registration

This activity is sponsored by Omniture. Priority will be given to current Omniture customers, identified leads, and anyone who's interested (in that order). Places are limited, please register directly with Omniture.

Register Now!

Agenda


5:30pm - 7:00pmRegistration | Networking | Food & Drink Catch up with old friends and make new ones
7:00pm - 7:30pmOmniture Client Services:
Ms. Marianne Llewellyn
Principal, Solution Design
Omniture
Maximizing Success with Omniture Best Practices
  • Learn about how you can benefit from working with the Best Practices team
  • Walk though high-value engagement examples
  • Take away some to-dos for evolving your use of SiteCatalyst
7:30pm - 8:00pmCustomer Best Practices A Case Study:
Mr. Stephane Hamel
Senior ebusiness architect
Desjardins General Insurance Group
  • Lessons learned
  • Problems solved
  • What worked and what didn't
8:00pm - 8:30pmOpen Discussion | Q&A
8:30pmNext Steps | Drinks & Dessert

Saturday, April 14, 2007

The Attention process

In previous posts about the attention economy and web analytics, we've set the table by describing what is, and what is not Attention. Let's now look at the Attention process itself.


The simple process shown above, taken from Davenport's book on Attention Economy, summarize wonderfully what we do, consciously, or not, hundreds of times a day. From simple activities such as finding something to eat to complex decisions such as changing job, they can all be summarized in those simple three steps.

Here, we want to look at "attention" as it relates to web analytics.

Awareness

We can clearly relate to marketing, in all its pride and glory. Be it the more traditional advertising or the use of new social media such as blogs and podcasts, we don't only want to be visible, we want to be notified. Think about the marketers role as it relates to improving the level of awareness.

Attention

We want people to narrow their mind on us. Except they don't spend their precious cognitive energy and limited available time without expecting nothing in return. They do it because they are looking to satisfy "something": being entertained, reading about the latest news, buying music or a car, planning a vacation or their next career move, the possibilities are infinite. As a strategist, we want to understand the visitor goals and, as Jim Novo judiciously say, set tripwires to help them do what they want (or better said, make them do what we want!). Here, those tripwires are really good candidates to become your KPI.

Action

Assuming we actually want to satisfy their need, the ultimate goal is to have them engage with us. That is, we want a positive outcome. As a business manager, this is what we want to measure and understand, so we can take quick decisions to achieve incremental improvements, or go back to the strategy drawing board and think about something else.

Web Analyst's role

As you might have guessed already, the web analysts role is to transform various sources of "data" into valuable "information". Here there's a clear distinction to make between the "information", such as the one presented by web analytics solutions, and the web analyst role to transform it into "knowledge" than can be understood and communicated appropriately. Then we can rely on the wisdom of the marketer, strategist and business managers to take the best possible decisions.
* Image from Bellinger, Castro, Mills.

Tuesday, April 10, 2007

Attention ≠ Time

In my previous posts about Attention and my recent opinion about Compete.com new attention metric, I challenged the common opinion that "time" and "attention" are synonyms.

M.David Cancel, CTO of Compete.com, was kind enough to leave a comment stating that "Attention measure is calculated using both "time" and "traffic" (measured by unique visitors), not simply based on time". Later in the same comment, M.Cancel says "Although unique visitors and page views are critical pieces of the puzzle - these metrics often fail to accurately measure engagement". Again, implying that "time" can be used as a valid measurement of "engagement" is, in my humble opinion, totally wrong.

Michael H. Goldhaber most recent post reinforce my opinion. M.Goldhaber is not just another blogger... he's been writing about the concept of Attention Economy since 1985 and is the author of a paper that became a classic in the field: "The Attention Economy and the Net", published "way back" in 1997.

Here's what he as to say about "time" and "attention":
It is commonly thought that attention can be equated with time. “I will give you fifteen minutes of my time,” often implies that speaker will pay attention for those fifteen minutes. It would be a mistake though, to think that this formulation means that attention is particularly tied with time. All human activities — eating or walking just as much as paying attention— occur in time, and each one has some duration. But the time taken has little to do with the quality or even the intensity of the attention paid.
If you would like to better understand the concept of the Attention Economy, read the book "The Attention Economy" by Thomas H. Davenport or the more recent "Competing on Analytics".

Conclusion: time ≠ engagement ≠ attention

Is "time" a component of "engagement" and "attention"? It certainly is... but we need to find the right equation!

Web Analytics in Quebec

Fellow blogger Lars Johansson, from Sweden, asked me a couple of days ago about my views on the web analytics market in Québec and Canada. We share similar interests as we both organize local Web Analytics Wednesdays, except he had to turn off people at his last event since the room was limited to 60 persons! I'm usually able to gather about a dozen people around a table... :)

So here's the Q&A that can also be found on the WebAnalysts.info blog.

Is there a difference in the way that businesses approach web analytics in Québec compared to the rest of Canada or North America?

First, the business scales are radically different. While Canada, EU and the US usually define a small business to be less than 500 employees, the market reach of those companies are radically different, with populations of 30M citizens in Canada, vs. 300M in the US and about 500M in the EU. This obviously have an impact on the financial structure of companies.

Québec represents a population of 7.5M people, 80% of which speaks French. The internet population is estimated by comScore to be about 4M people.

A large Web site in Québec, say, one that register over 500,000 unique visitors a month, is a drop in the ocean when compared to their US equivalents. The reality, as reported by newspaper La Presse, is that only 20 of the top 50 most visited sites in Québec are really made in Québec (the other being the Google, Yahoo and YouTube of this world), and most of them claim an audience reach well below 1M.

My experience is that probably something like 80% of the corporate web sites (i.e. excluding blogs) receives traffic between 1M and 2M pages views a month or say, somewhere between 100,000 and 200,000 visits a month.

How does this impact web analytics practices? Considering most WA solutions are service based, and most of them include an entry price tag and elements of “cost per use”, we easily reach the psychological barrier of over 10,000$ CAD/year. That’s certainly where Google Analytics could benefit the most (a bit more on that below). The other negative element is that most web teams are working with unrealistic budgets that still do not compare to traditional media… if there’s a web team at all!

So the web analytics practice is one of compromises, almost cited in the last bullet point of the task list, just before “and all other related tasks”.

Describe the growth for web analytics in your area?

I think the trend is similar to other places such as the US and Europe… except the scale is different… We very rarely see job posts for positions dedicated to web analytics (I heard about one in 6 months!) but the web job market in general, and IT in particular, is suffering from a lack of available resources. Most consultants works for local web agencies (Césart, Hue Agence, Nurun) as emarketing or SEO specialists and fill the gap in web analytics. I know only one free agent, my friend Jacques Warren, who’s been in the field for five years and just recently made the jump to become a full time web analytics consultant.

What's the biggest challenge right now?

Clearly, the biggest challenge in Québec is that we’re still in a phase of “education”. It’s amazing to see how many managers still “don’t get it” that the Web is not “something else”, but an unavoidable part of their marketing/sales/support toolkit. Getting them to understand the key role of web analytics, and allowing someone to look into it is even more difficult.

In this context, it seems that Google Analytics (or other free or very low cost solutions) would be a winner. Interestingly, we see lots of bloggers and very small sites using it, and a few larger ones, but it seems they are still “reporting” rather than doing real analysis.

What’s next?

I will stay involved in the Web Analytics Association and continue to organize the local Web Analytics Wednesdays. As a practitioner, I’m very proud to have the chance to present the WAA course on site optimization at the next eMetrics in San-Francisco. I’m grateful to have my employer entire support and collaboration, a real exception that can be traced back to the corporate values of Desjardins (named best employer in Quebec!).

Friday, April 6, 2007

Cleaning up data before analysis

Prof. Gauvin from Laval University contacted me to share an interesting challenge for a new study he will be conducting. I'm sharing his inquiry because I think there could be some application in the web analytics field. It also relates, in a way, to my previous post about box and whisker plots, especially when I talked about outliers.

Detecting outliers

Let's say the above chart represents traffic to a site. Something is obviously wrong between time 24 and 28. If we were to do a box plot, we would see the values over 700 to be outliers. As an analyst looking at the data, and depending on the context, we might, or might not, want to exclude those extreme data points from our analysis.

In this example, is the sudden spike a case of server misconfiguration or a software bug? An attack or a bot repeatedly hitting our web site, or maybe the effect of being Digg'ed? Again, the data needs to be put in context in order to provide a good story.

A more complex situation

The other example might be more realistic, but is also much more complex.
Now we have a situation were a trend is suddenly being disrupted by something, making the whole base level shift from it's regular "State A" to a new level at "State B". We also see some impulses affecting the trend.

The law of relativity

Now imagine we were to do daily analysis as data becomes available. When we reach the 16th data point, it will show as an outlier. But as we progress toward the 20th data point, they might become valid data. So depending on the data range we use, even if it is statistically valid, outliers might change dramatically. But we don't know what to expect after the 71th data point and beyond... any guess?

The challenge

We're wondering if there is a mathematical way to detect state changes and impulses in a data set. And to make it even more complex, how could we use predictive analytics as we move along the data set? Any help would be appreciated.

P.S. I'm still negotiating with my boss to be able to register for the course on predictive analytics at the eMetrics Summit...

Vote for me! Montreal TechWatch innovator of the month

MontrealTechWatch is conducting a survey for the "innovator of the month", and I'm proud to be listed as one of the five contenders for my involvement in the local web analytics community. Please take a second to vote for me!

Thursday, April 5, 2007

Compete.com twisted "attention" metric

Compete recently introduced a new feature called "Attention", which they simply equate to the time spent on a site versus all other sites on the Web. I've been discussing the concept of attention economy in web analytics for a while and the recent introduction of Compete.com, although interesting, is too narrow.

I'm surprised so many bloggers, especially those involved in web analytics, jumped on the bandwagon and are giving Compete so much "attention"! Let me explain my point of view.

I think there is something fundamentally wrong with the implicit association that "attention = time". Attention is "the cognitive process of selectively concentrating on one aspect of the environment while ignoring other things". Although the time is one factor of attention, research demonstrated there are very different brain level activity going on depending on the cognitive involvement of that activity.

Example

Let's just take one of the many examples: eBay, YouTube, MySpace. In this example, we clearly see MySpace receives a magnitude more "time" (no, I won't say "attention"!) than eBay, and eBay more than YouTube. First impression: I'm surprised... But my point is the type of "attention" is really different when we look at each of those sites. Do they share the same attention characteristics? Even if you spend an hour in each of those activities, do you have the same experience when doing grocery or shopping for a new MP3 player (eBay), looking at TV (YouTube) or visiting friends (MySpace)? I hope not!

Compete 200

The "Compete 200" isn't much better, saying MySpace receives more attention is just plain wrong. Saying we spend more of our free time on MySpace might be right, but I can guaranty you spending an hour on MySpace is really not the same thing as spending an hour checking my finance status at my online bank! Which one is more voluntary or averse? Which one is involves more brain power (front or back of mind), and of course, which one is more attractive...

Credit where credit is due

Compete.com is not all wrong, I'm not saying that! It does offer a new interesting information that was not available before. At least, not presented that way. I just disagree that attention = time.

What do you think? Am I being to picky? Is there some basis to my argument? Do you agree?

Wednesday, April 4, 2007

Instances vs. Visits in Omniture

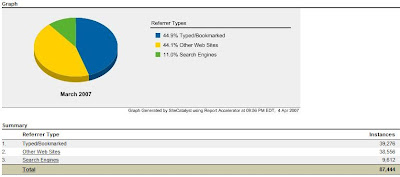
An interesting question was posted to the Web Analytics forum: why is Omniture reporting higher referral instances than visits to a site?

What is a visit?

Omniture says "a visit is a term that refers to a visitor’s access to a website. The visit begins when a person first views a page on your company's website. It will continue until that person stops all activity on the site for 30 minutes." You might want to view my previous post on the atoms of web analytics.

What is an instance?

Again, Omniture says "an instance as relates to the number of times that a unique event occurs in SiteCatalyst". First, I wouldn't say in "SiteCatalyst"... the event occurs on my site, but that's a detail. An instance = count of event.

The counts doesn't match up!

In the screen snapshot above, the number of visits is 62,013 while the number of instances for 87,444... How can SiteCatalyst register 41% more instances than visits? But wait! We're not measuring apples with apples. Instances and visits are two different measurement units.

Let's do an example

Nothing better than an example to demonstrate the difference.
TimeUser activityVisitsInstances
8:00pmA visitor goes on Google and do a search for "web analytics".


8:01pmThat visitor click on a link to "immeria.net"
+1+1 from Google
8:05pmThe visitor browse a few pages and leave my site.


8:06pmThe visitor goes back to Google and do a search for "Omniture 3rd party cookie" and find the second entry to be an article from my site+0+1 from Google
8:15pmThe visitor does a "back" and look for other results from Google, than find the fine piece about "Web Analytics technical implementation best practices".

8:30pmAfter reading the article, the visitor look at the comments. One of them links to my site+0+1 from kaushik.net
9:30pmThe visitor leave for more than 30 minutes since the last hit to my site, then come back and click on my home page link.+1

End result:2
3

Hope that helps!

Tuesday, April 3, 2007

The "analytic" in "web analytics"

In my previous posts on the exploration of the Attention Economy in web analytics, I highlighted the use of RFM in marketing as well as some views on the user engagement metric. Let's now take a few minutes to get back to the basic: what is web analytics?

What is web analytics?

Web analytics relies on a variety of qualitative and quantitative metrics to evaluate the effectiveness of a site at answering user goals, according to the business strategy and objectives. The analysis activity brings a broader and more accurate understanding of the user behavior before, during, and after the visit to the site. This understanding of threats and opportunities ultimately leads to recommendations for improvements in various areas: user experience, content quality and effectiveness, process improvement and technical performance.

The atoms of web analytics

While the vast majority of businesses understand and agree on what constitute an "impression", less than half agree on what exactly is a "visit" or worse, a "visitor" (74% according to a Net Genesis Corp, Jim Sterne, 2000 study). A recent thread on the web analytics discussion forum seems to indicate things haven't changed that much in 7 years!

At the beginning of the World (Wide Web) there were only "hits" - the most basic and simple element at the base of the HTTP protocol. A very technical and low-level representation that quickly became too hard and inconvenient to manipulate.

The next definitions are taken verbatim from the Web Analytics Association Standard Committee:
  • Page Views: The number of times a page (an analyst-definable unit of content) was viewed.
  • Visit (or session): A visit is an interaction, by an individual, with a web site consisting of one or more requests for an analyst-definable unit of content (i.e. “page view”). If an individual has not taken another action (typically additional page views) on the site within a specified time period, the visit session will terminate.
  • Visitor: The number of inferred individual people (filtered for spiders and robots), within a designated reporting timeframe, with activity consisting of one or more visits to a
    site. Each individual is counted only once in the unique visitor measure for the
    reporting period.
Since our goal isn't to dig too much into the web analytics practice itself, and for sake of simplicity, we will not delve into the intricacies of Rich Internet Applications measurement or more complex metrics. These simple metrics; page view, visit and visitor, will be sufficient to understand the evolution to "attention" metrics.

What constitutes a transaction?

Another area that seems to confuse everyone is the notion of "transaction". To my surprise, I found out in an important ebusiness project the definition of a transaction is very different depending on who I talked to. The IT people related to a database "transaction" while marketing people used interchangeably the words "conversion" and "transaction", or considered any type of online form that submits some information to be a transaction.

In financial terms, Wikipedia definition says "a financial transaction involves a change in the status of the finances of two or more businesses or individuals."

The monetization of attention

The definition of a financial transaction is critical in the concept of "Attention Economy": money was typically the scarce and sought for resource. In the industrial age, the more you had, the more successful you were.

In the information age, money isn't the scarce resource people are seeking. What we lack, what we have in limited quantity and what we need to spend carefully is our attention. What every company is trying to get from us is our attention. Our whole economical model is slowly shifting from valuing money to valuing the "cognitive process of selectively concentrating on one thing while ignoring other things". Simply put, once you get attention, other "lower" considerations such as money usually come naturally. Think about artists, politicians, managers, and even some bloggers!

We've set the table for the next step: the attention process.

Web Analytics Wednesday, April 11th, Montreal

April 11th Web Analytics Wednesday is coming up!
English version further down.

La prochaine rencontre Web Analytics Wednesday aura lieu à Montréal, le 11 avril. Cette fois, mon ami Jacques Warren prendra ma relève pour animer la soirée puisque je ne pourrais pas être présent.

Ça vous intéresse?

Lieu:
Le Cartet
106 rue McGill
Montréal, QCH2Y 2E5
(514) 871-8887
Google Map

Nous aurons une table réservé vers 18:00h à l'arrière du restaurant. Demandez Jacques Warren.

RSVP: réservez en me faisant parvenir un courriel, en laissant un commentaire ou en ligne.

Si vous connaissez d'autres personnes susceptibles d'apprécier ces rencontres, vous êtes encouragés à leur en faire part!

La rencontre de mai promet d'être fort intéressante puisque si tout va comme prévue, nous aurons le tout premier Omniture Café à Montréal!

-----

The next Web Analytics Wednesday will be held in Montreal, on april 11th. This time, my friend Jacques Warren will play the host as I won't be able to make it.

Interested?

Location:
Le Cartet
106 rue McGill
Montréal, QCH2Y 2E5
(514) 871-8887
Google Map

We will have a table reserved at the back of the restaurant around 6:00pm. Ask for Jacques Warren.

RSVP: send me an email, leave a comment below or on line.

If you know other people who might be interested, let them know!

May's meeting promise to be very interesting, we will hold the first ever Omniture Café in Montréal!