Update 2010-05-07: If you want to use this dashboard with Google Analytics data, check out "Tatvic enhances immeria's Excel web analytics dashboard".
Attention Internet Explorer users (MSIE)! When clicking on the link to download the .xlsx template, MSIE wrongly try to save it as a .zip file, which it's not. Make sure to rename the file with the proper .xlsx extension (or better yet, switch to Firefox!)A couple of weeks ago I published "Web Analytics Dashboards: fun with Excel 2007", it got on Stumbled and became one of the most visited article. A while back I also published Box plots and whisker plots in Excel 2007 and it consistently receives a lot of views.
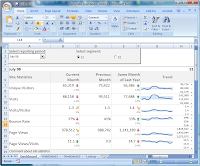
 So here's an update of Web Analytics Dashboard Fun with Excel 2007!
What is it?
I'm glad to release "Web Analytics Dashboard Fun" (Microsoft Excel 2007, 85KB .xlsx), a free Microsoft Excel 2007 template for web analytics professionals. It can be used for learning web analytics, Excel in general or as the basis for more elaborate dashboards. The goal is to use only Excel 2007 features and ease customization of the template and update of the data.Why Excel?
As a teacher of web analytics and a web analyst myself, I noticed people often struggle to define KPIs and get going with dashboards. My clients use different web analytics tools, be it Omniture, Google Analytics, Coremetrics, WebTrends, Xiti or others. Although some of the tools offer very advanced dashboarding and analysis capabilities, there are a number of reasons why you would want to use Excel:- Control the information being distributed
- Publish the information in a format people are used to (either Excel or PDF)
- Avoid granting access to the web analytics tool itself
- Include other sources of data
- Ease "month to month" and "year to year" analysis
- Ease analysis of major segments (such as two countries, two sites, etc.)
- Include the analyst comments and evaluation
Get Web Analytics Dashbaord Fun!
Based on the feedback I got, and some further tweaking to make the dashboard more generic and easier to modify for your needs, I'm releasing "Web Analytics Dashboard Fun with Excel 2007 v1.1". To get started there are just a few steps:- >>> Get the template <<< (Microsoft Excel 2007, 85KB .xlsx)
(Get the Excel 2003 version - with some features disabled)
- Right-click on the S1 and S2 radio button and "Edit Text" to your licking
- Change "Success Event 1" through "Success Event 3" in all worksheets
- Update the data in WebDataS1 and WebDataS2
- Voilà!
Feedback, comments and contribution
One of the goal of immeria.net is to "make it easy to do web analytics" by providing educational ressources, documented processes and tools that are both easy to use and non-specific to a vendor ("product agnostic"). You are free to use this template, modify it and even redistribute it as long as its not for profit.Web Analytics Dashboard Fun by immeria.net is licensed under a Creative Commons Attribution-Noncommercial-Share Alike 2.5 Canada License.