Some theory of "quality metrics"
One of the element we cover in the Web Analytics for Site Optimization class I'm tutoring for the UBC Award of Achievement is the definition of a "quality visit metric" and how it will be measured. If we want to understand what are the set of conditions and rules we, as a business, consider to be a successful visit, those conditions and rules can necessarily be converted into a single indicator (be it a red/yellow/green indicator, a trend or a number). In my opinion, this is an essential part of "process optimization": when you can simplify a complex task to the point of its simplest activities in the form of input-transformation-output, each of those sub-tasks can be measured. Regrouping those measures into what some call a "mashup metric" or "uber metric" makes sense. We are talking about "process theory" and "goal setting".Quality Control concepts
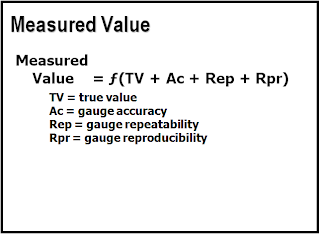
There's a Quality Control class by Prof. Trout, Associate Professor of Management at Saint Martin's University. In chapter 4 of his class, prof. Trout talks about "measurement" and "metrics". Please allow me to grab a couple of slides from his great lecture notes:Can a "mashup metric" be accurate and precise?
To continue with the target analogy, Belkin seems to say "no" because the distance, the size of the target and the circumference of the circles are mostly subjective and arbitrary. So you could end up with an accurate and precise bow, but the target wouldn't be reliable. I must say that viewed this way, there's some logic to this argument.
If each task can be gauged and provide a "Measured Value", then a "mashup metric" is the sum (or factor or whatever formula you want to use) of all the "Measured Values" of each sub-tasks leading to a measurable process. The "Measured Value" themselves are not subjective, it's the weighting and tresholds that could be. But again, if we look at each individually measured value, we can easily define the lower/upper control limits, standard deviation and averages and use them in our mashup formula.
Now lets look at two other slides:
Does a "mashup metric" satisfy the conditions of an effective metric?
Again, Belkin says "no" arguably because the mashup metric by itself can't tell you which underlying value went out of wack. But I disagree, for a mashup metric, the "actionable" aspect is "raising the red flag so it gets your attention". A red light is actionable.
Again, some important points here: spot, compare and predict. But also a) "collecting" doesn't lead to anything unless you act on it and b) higher quality companies use fewer metrics... interesting isn't it?
Some practical use of "mashup metrics"
Check the image below:I often say "it's not about the numbers, it's about the story you can tell about them". So here's what goes with this picture:
"the fuel delivery system broke. Kaput.Credits for picture & story: Peter Norby, AKA Driver
...
Luckily, they were able to get the car in drivable condition by fixing up some wires so that there wouldn't be any sparking to cause fires, and fuel delivery was working fine.... we just couldn't tell how much gas we had in the tank. So, we just used the trip meter to tell when to fill up.
...
However, seeing the "empty" gauge every time you look at the dashboard (along with the check engine light) was a tad distracting, so our friend Kristine drew up a little card to stick in front of the fuel gauge"
The small handwritten note that hides the gas gauge says "It's OK. There is PROBABLY gas! :)"
Read again: one metric down is very different from a broken gauge + check engine light. The Check Engine we have on all our cars is an amazingly complex mashup of metrics... Yet we don't see it lighten up because our tank is empty... It's quite accurate, and very actionable!


